The Graph
The Process Lasso graph shows a calculation of system responsiveness, overall CPU and GPU utilization, and the memory load. The system responsiveness is calculated using a proprietary algorithm that measures the latency in the user interface (windowing) subsystem.
Highlighted portions of the graph indicate that a ProBalance process restraint occurred during that period. This can help you see the impact of Process Lasso on system responsiveness.
Highlighted ProBalance Events
During periods when ProBalance takes action to ensure your system responsiveness remains high despite a spike in CPU use, the graph will be highlighted. The log can be referenced to see what actions were taken.
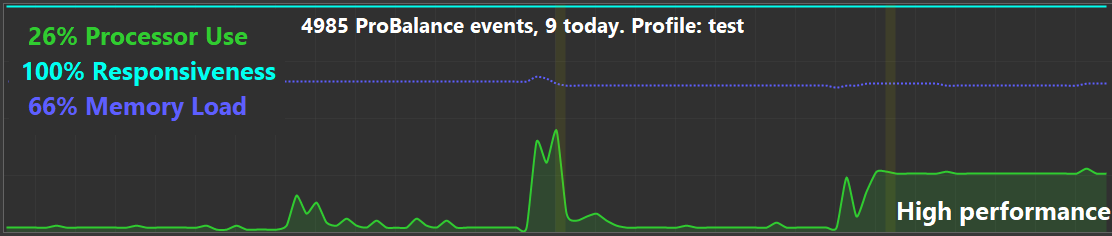
Note these colors are reversed in more recent versions!
Hovering over a highlight event will show you the process(es) adjusted (in priority or CPU affinity) at that time.

GPU Performance Data
GPU utilization is shown on the primary graph, a dedicated widget, status bar, and in the process lists.

Since any inspection of GPU performance data incurs some amount of overhead, often showing up in ntoskrnl.exe, this data is only collected when Process Lasso is visible. Due to this, some periods of GPU data may be missing from the graph. GPU utilization reporting can also be disabled entirely in the “View / Graph” menu.
Beta
The menu paths on this page are those of the current Process Lasso beta versions, and arrive in the next final release. Until then, the ‘View / Graph’ menu is named ‘View / Graph Components’, and GPU Collection is in ‘View / Graph Components / GPU Collection’.
The process lists can also show how much GPU memory each process uses. See GPU Memory.
GPU Collection Modes
Beta
The Automatic mode as described here is in the current Process Lasso beta versions, and arrives in the next final release.
The per-process GPU % column needs a query for each process, so Process Lasso offers three ways to choose which processes it measures, in “View / Process List / GPU Collection”:
| Mode | Measures each refresh | Use it when |
|---|---|---|
| Automatic (recommended) | Rows on screen, every process that used the GPU recently, and a rotating share of the rest | Almost always. This is the default. |
| All Processes | Every process | You want every value exact at every refresh and accept a little more overhead. |
| Visible Rows Only | Rows on screen | You want the least overhead and only care about the rows you can see. |
In every mode, sorting the process list by GPU % measures every process each refresh, so the sort order is correct.
Automatic works like this:
- Rows on screen are measured every refresh.
- A process that shows any GPU use keeps being measured every refresh, wherever its row is, until it has been idle for about 30 refreshes.
- Every other process is checked about once every 8 refreshes, so a game or other GPU load whose row is scrolled out of view gets its GPU % within about 10 to 20 seconds at the default refresh rate, keeps it, and appears in Active Processes.
- GPU engines a process isn't using are checked less often. If an engine is busy but the measured processes don't account for it, Automatic checks those engines sooner; if they still can't be accounted for (for example, the work belongs to a process Process Lasso can't open), it backs off again so the extra checks don't continue all session.
- If measuring part of the list isn't enough on a system, Automatic switches to measuring every process, and later checks whether it can switch back.
Cost: Per-process GPU queries are only made while the Process Lasso window is open (not minimized), the GPU % column is shown, and “GPU Use” is enabled in “View / Graph”. Closed to the tray, minimized, or with the column hidden, they cost nothing.
GPU Memory Bar and Line
Beta
The GPU memory bar and the GPU memory graph line are in the current Process Lasso beta versions, and arrive in the next final release.
Process Lasso can show how full each GPU's memory is, in two places:
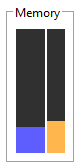
- GPU Memory Bar
A second, narrower bar inside the RAM load widget, to the right of the RAM bar and in the GPU color. While it is shown, the widget is captioned ‘Memory’ instead of ‘RAM’. With more than one GPU, the bar shows the fullest one. - GPU Memory line
A dashed line on the graph in the same color as that GPU's utilization line. It follows the same ‘Line Graph Source’ choice as GPU utilization: one combined line (the fullest GPU), or one line per GPU.
Turning Them On and Off
Both are in the ‘View / Graph’ menu, below ‘GPU Use’, and in the menu that opens when you right-click the GPU widget:
| Menu item | Shows | Default |
|---|---|---|
| GPU Memory Bar | The bar in the RAM load widget | On |
| GPU Memory | The dashed line on the graph | Off |
Both need ‘GPU Use’ turned on, and both are unavailable on a PC where Process Lasso can't read GPU memory (Windows 7, or no supported GPU). The bar also needs the RAM load widget to be shown.
What the Bar and Line Show
Each GPU is shown one of two ways, depending on where its memory comes from:
- Dedicated GPU memory
For a graphics card with its own video memory: dedicated memory in use, as a share of the card's dedicated memory. This matches ‘Dedicated GPU memory’ on the Performance tab of Windows Task Manager, and is the figure to watch when a game or an AI model runs out of video memory. - GPU memory
For a GPU that uses the PC's own RAM, which is the case for most integrated graphics: dedicated plus shared memory in use, as a share of both limits together. This matches the ‘GPU memory’ figure in Task Manager. The shared limit is normally half of the PC's RAM, so these percentages are usually low.
Process Lasso treats a GPU as the second kind when it has less than 1 GB of dedicated memory, or when its driver reports that its memory is system RAM. Integrated GPUs typically report a small dedicated amount, such as 128 MB, and keep nearly everything they use in shared memory; measured against that small amount alone, they would always read close to 0%.
A GPU normally keeps the same kind for as long as Process Lasso runs, so a line on the graph does not change meaning partway along.
Tooltips and Legend
- RAM load widget tooltip: Below the RAM figures, one line per GPU with the amount in use, the limit and the percentage, for example Dedicated GPU memory (NVIDIA GeForce RTX 5060 Ti): 4.7 / 15.7 GB (30%). The line says GPU memory for a GPU shown the second way. With more than one GPU, each line starts with the GPU number.
- GPU widget tooltip: Hovering over a bar in the GPU widget shows the GPU's name and, below it, the same memory line for that GPU. The combined bar lists every GPU it covers. The memory line is there while the GPU Memory Bar or the GPU Memory line is turned on; with both off, the tooltip shows the name only.
- Graph tooltip: Hovering over the graph shows the same line for that moment, whenever the bar or the line was on at the time.
- Graph legend: A ‘GPU Memory’ row appears while the GPU Memory line is on. When the graph is too small for the whole legend, this row is the first to be left out.
When Nothing Is Shown
Like GPU utilization, GPU memory is read only while the Process Lasso window is visible, and not at all while both the bar and the line are turned off. So the line can have gaps for periods when the window was hidden or minimized. If a GPU can't be read for a moment, for example while its driver restarts, the bar is empty and the line has a gap until it can be read again.
To see which programs are using the memory, turn on the GPU memory columns in the process lists.
Aggregated CPU Use of Selected Processes
With Process Lasso you can see the individual CPU history of process(es) you select in the process list. The CPU utilization history of all processes currently selected (highlighted) in the process list is drawn as a smaller white line on the graph, as indicated by the arrow below. In this example, several CPU-consuming processes were selected, so the line shows their combined CPU use.
