Process Info Columns
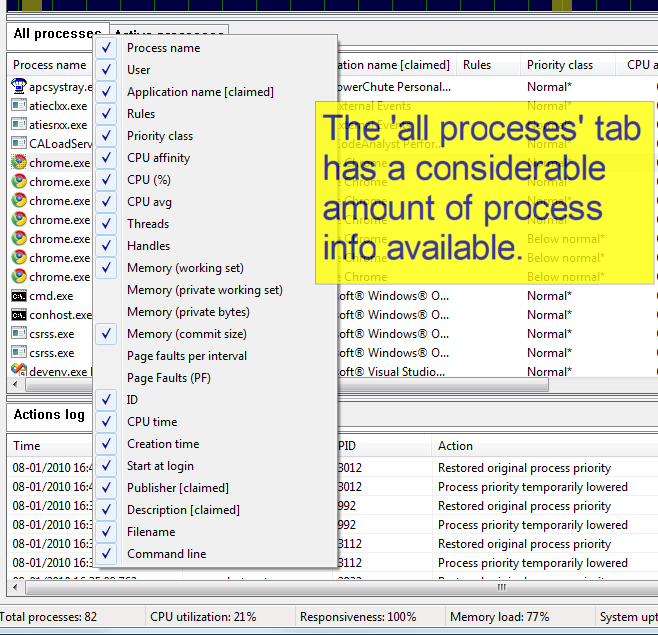
You can select which columns you want visible by right-clicking on the ‘All processes’ tab, right-clicking on the list header, or using the ‘View / Process List / Columns: All Processes’ menu. In addition, you can resize the columns (at their headers) and change the column ordering by dragging the column headers. These view changes will be remembered by Process Lasso. The same applies for the ‘Active processes’ tab. Note that right-clicking the ‘Active processes’ tab allows for setting process information shown in that column. Information in the ‘Active processes’ tab is more limited than information in the ‘All processes’ tab. However, double clicking on any process in the ‘Active processes’ tab will take you to its entry in the ‘All processes’ tab.
Beta
The menu paths on this page are those of the current Process Lasso beta versions, and arrive in the next final release. Until then, the column lists are in ‘View / Choose Columns’, and ‘GPU Use’ is in ‘View / Graph Components’.
Rules
The Rules column in the process list provides a shorthand notation of rules set for each process.
Format: [+|-][X][E|e][L][_][x][W][g][K][#n][d|D][f][p][Mx][t][s][iX][<..<<<<][RHANBI][0-63](0-63)
| Character(s) | Meaning |
|---|---|
| + | Dynamic Thread Priority Boosts ON |
| – | Dynamic Thread Priority Boosts OFF |
| X | Excluded from ProBalance |
| E | Efficiency Mode ON |
| e | Efficiency Mode OFF |
| L | CPU Limited |
| _ | Instance Balanced |
| W | A watchdog rule is set |
| g | Process induces Performance Mode |
| K | Keep running (restart if terminates) |
| #n | Instance count limit of n, e.g. #2 for a limit of 2 |
| d | D |
| x | Excluded from foreground boosting |
| f | IdleSaver is disabled when this process is running |
| p | Has a power plan rule |
| M# | Where ‘#’ is the memory priority set for this process. |
| t | Excluded from SmartTrim |
| R | Priority class: Real time |
| H | Priority class: Highest |
| A | Priority class: Above normal |
| N | Priority class: Normal |
| B | Priority class: Below normal |
| I | Priority class: Idle |
| ih | I/O priority class: High |
| in | I/O priority class: Normal |
| il | I/O priority class: Low |
| ib | I/O priority class: Very Low (background) |
| 0-63 | CPU Affinity |
| (0-63) | CPU Set |
| < | Hard throttle: lowest |
| << | Hard throttle: low |
| <<< | Hard throttle: moderate |
| <<<< | Hard throttle: high |
Status
Possible values can be any combination of:
- Efficiency
The process is running in full Efficiency Mode, EcoQOS plus an idle priority class. - Efficiency (partial)
The process is running in EcoQOS but at a non-idle priority class. - Suspended
The process is paused. It won’t respond to user input, or anything else, until resumed. Users typically don’t manually suspend or resume a process. UWP applications are most commonly seen in a suspended state. - Restrained
The process is currently being acted on by ProBalance. It is not actually impeded, so performance will not drop. Rather, it is merely adjusted in priority class so that the system has enough CPU cycles to respond to any user input that may occur.
ProBalance Time
The amount of time this specific process instance has been under ProBalance restraint. It is not the accumulated total for all historical instances of that process; for that, use the ‘Insights’ button to launch the ProBalance Insights tool.
GPU Memory
Beta
The GPU memory columns, and the GPU memory figures in Export for AI Analysis, are only in the Process Lasso beta versions for now, and arrive in the next final release.
Two columns show how much graphics memory each process uses:
- GPU memory (dedicated)
Video memory on the graphics card that the process uses. This is the figure to watch when a game or an AI model runs out of video memory. - GPU memory (shared)
System memory (RAM) that the process uses through the GPU.
Both columns are available in the ‘All processes’ and ‘Active processes’ tabs, and both are hidden until you turn them on: right-click the list header, or use ‘Columns: All Processes’ or ‘Columns: Active Processes’ in the ‘View / Process List’ menu. You can sort by either one. On a PC with more than one GPU, each figure is the total across all of them.
What the Numbers Mean
- The figures match the Dedicated GPU memory and Shared GPU memory columns on the Details tab of Windows Task Manager.
- Some shared GPU memory in use is normal. It does not mean that video memory is full. Integrated graphics have little or no dedicated memory, so on those almost everything appears as shared.
- Memory that several programs share can be counted for each of them, so the column can add up to more than the total in use.
- Tools that read the Windows ‘GPU Process Memory’ performance counters can show higher figures for the Desktop Window Manager (dwm.exe) and a few other programs. Process Lasso and Task Manager's Details tab report the lower figure.
When a Cell Is Empty
- Empty: The process uses no GPU memory, or Process Lasso can't read it.
- A dash (-): GPU monitoring is turned off. Turn it on again with ‘View / Graph / GPU Use’.
Process Lasso can't read the GPU memory of a process that Windows only lets it open with limited rights. That is the case for a few protected system processes, such as System and csrss.exe, and for more processes when Process Lasso runs without administrator rights. Their cells stay empty, and Process Lasso checks them again only about once an hour, so that it doesn't keep asking Windows for access it won't get.
How Often the Figures Update
Like GPU utilization, GPU memory is read only while the Process Lasso window is visible, and nothing is read while both columns are hidden. With a column shown, Process Lasso reads the processes on screen, each at most every two seconds. A process that has used no GPU memory so far is checked every 10 to 15 seconds, so a program that has just started to use the GPU can take that long to show a figure. While the list is sorted by a GPU memory column, every process is read, not only those on screen.
In Export for AI Analysis
The report made by ‘Help / Export for AI Analysis’ includes GPU memory too, whether or not the columns are shown: how much dedicated and shared memory is in use on each GPU, and the GPU memory of each program in the list of running programs. A recording made with Record a Problem... reports the highest GPU memory each program reached while it was recorded. The report leaves GPU memory out when GPU monitoring is turned off. See Analyze Your PC With an AI Assistant.